In 2014, New York City became the first U.S. city to adopt Vision Zero, committing to eliminate traffic deaths and serious injuries. Since then, the city has made meaningful progress: traffic deaths fell to a record low in 2025 and are down 31 percent since Vision Zero launched. To drive these gains, city officials have expanded the use of proven street safety measures, from street redesigns and speed cameras to leading pedestrian intervals, protected bike and bus lanes, daylighting, traffic calming, and lower speed limits—life-saving work that has helped make the city more livable for all.
But that progress is not yet felt the same everywhere. This report—the first from the Center for an Urban Future’s new Project for Livable Streets—finds that the neighborhoods facing the greatest danger from traffic on city streets are disproportionately lower-income communities of color, and that many have yet to benefit from the full street safety toolkit.
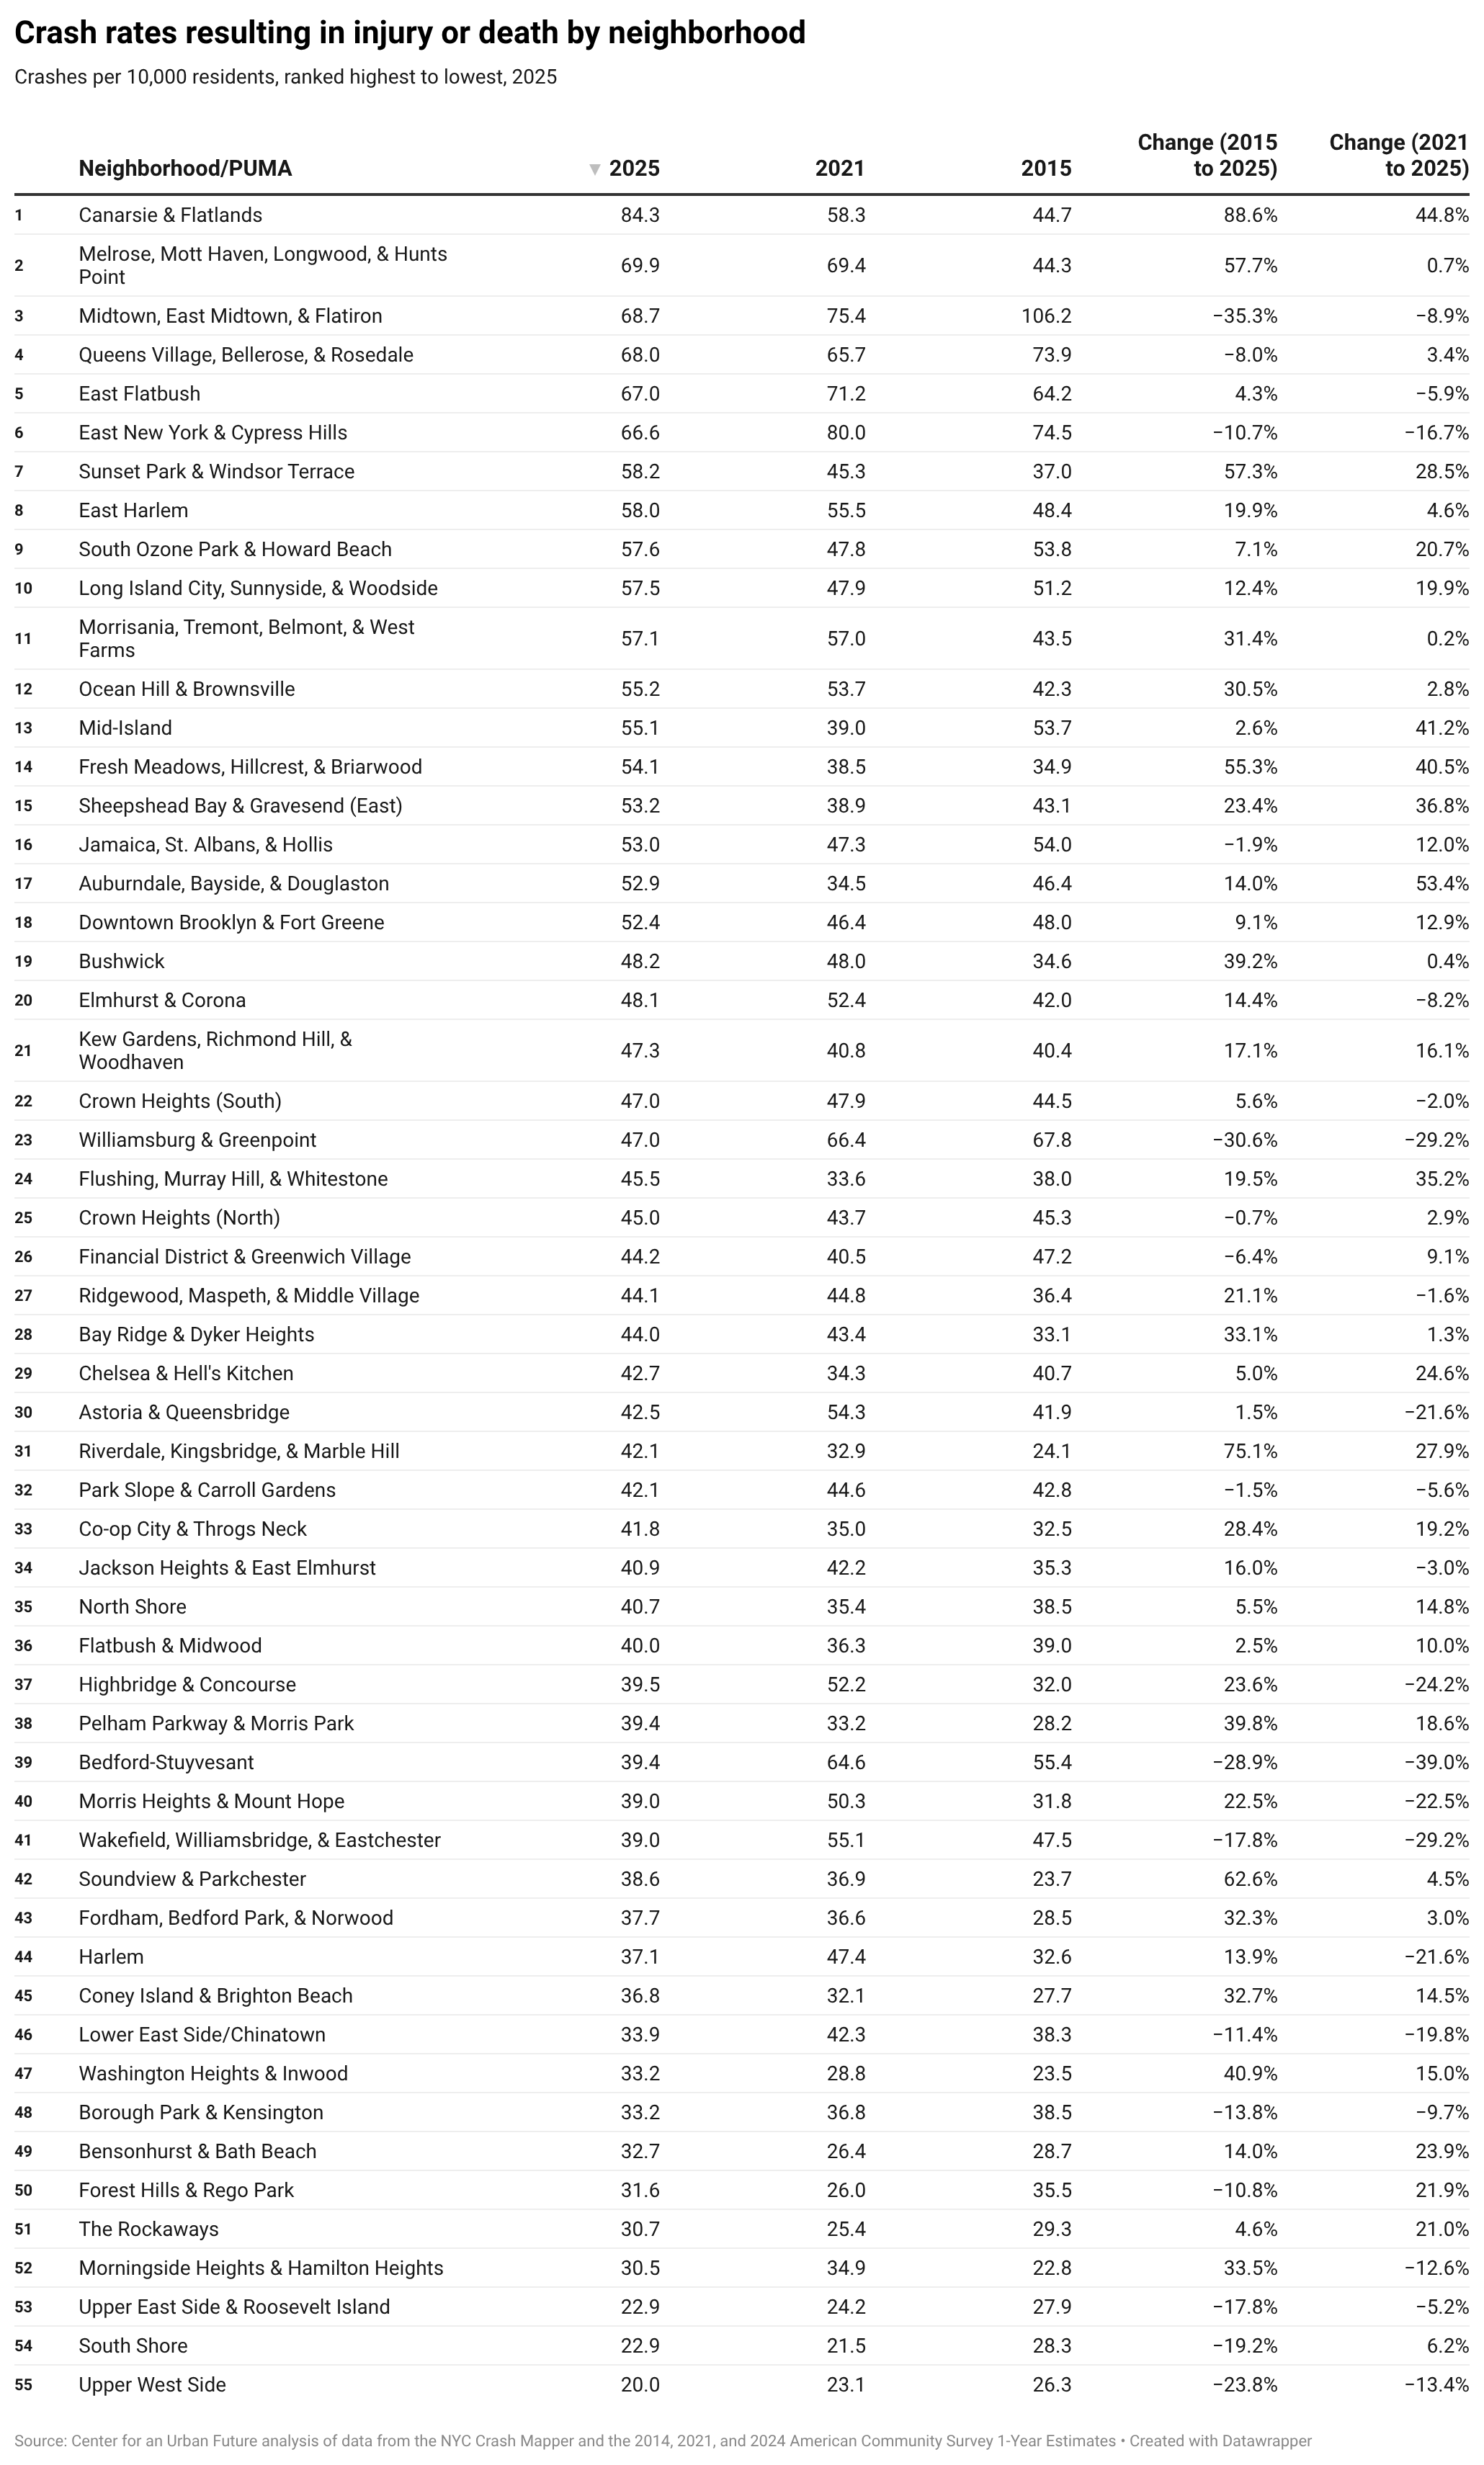
The disparities in serious crash rates are stark.1 In Canarsie and Flatlands—the city’s highest-risk neighborhoods—there are 84 serious crashes per 10,000 residents, nearly double the citywide average of 47. In total, eight of the ten neighborhoods with the highest per-capita serious crash rates are lower-income communities of color. Several of these same neighborhoods are also moving in the wrong direction, with serious crashes rising sharply in Canarsie and Flatlands, Sunset Park, the Rockaways, and South Ozone Park since 2021.
Livable streets investments can reduce harm when they are deployed at sufficient scale. Redesigned corridors can shorten crossing distances and slow turning vehicles. Leading pedestrian intervals can give people on foot a few crucial seconds before cars begin moving. Daylighting, or moving street parking further away from the crosswalk, can make pedestrians visible to drivers. Protected bike and bus lanes can organize chaotic streets and reduce conflicts among drivers, cyclists, bus riders, and pedestrians. Lower speed limits and slow zones can make crashes less likely—and less deadly when they do happen.
But while the city has stepped up these interventions citywide over the past decade, our analysis finds that neighborhoods facing disproportionate risk have often received fewer of these life-saving investments than other parts of the city.
Neighborhood slow zones, where speed limits are lowered alongside measures like turn-calming and daylighting, remain concentrated in more central neighborhoods. Downtown Brooklyn has 17.3 miles of slow zones, the Lower East Side has 11.4 miles, and Astoria has 7.29 miles. By contrast, East New York has just 3.7 miles, Brownsville has 3.6 miles, and the vast majority of central and eastern Queens has none.
The same uneven pattern appears in leading pedestrian intervals, which give pedestrians a head start before cars begin moving from a red light. These interventions have been heavily deployed in areas like Bedford-Stuyvesant, Crown Heights, and Downtown Brooklyn. But gaps persist in East Flatbush, East New York, and Canarsie and Flatlands. Coverage also thins out in eastern Queens and the east Bronx, including in Ozone Park, Queens Village, Laurelton, Pelham Bay, Morris Park, Wakefield, and Throgs Neck.
Major street safety projects show a similar divide. Williamsburg and Greenpoint have 29 miles of corridor coverage and 61 intersection projects, alongside a more visible buildout of bike and pedestrian infrastructure—helping to drive serious crashes down 29.2 percent over the past five years. East and central Flatbush have received significantly less corridor coverage. In Queens, large gaps remain in Ridgewood, Middle Village, Maspeth, Ozone Park, St. Albans, Whitestone, and other central and eastern neighborhoods where crash risks remain stubbornly high or are rising.
Some of the most glaring gaps involve older adults. Senior pedestrian zones extend crossing times, add pedestrian safety islands, widen curbs, and install new signals in neighborhoods with higher concentrations of older residents, who account for roughly 40 percent of pedestrian deaths citywide. But Coney Island and Brighton Beach—the area with the city’s highest concentration of residents age 65 and older—have no senior pedestrian zones.
The data strongly suggests that these investments make a difference. Sunset Park, which has above-average crash rates and rising serious crashes, has just 10 turn-calming measures and 12 intersection safety projects. Next door, Kensington and Borough Park have 80 turn-calming measures and 40 intersection safety projects, along with one of the city’s lowest per-capita serious crash rates. Manhattan’s East Harlem, where serious crash rates have risen in recent years, has 36 speed bumps and one enhanced crossing. The Upper West Side, which has the city’s lowest per-capita serious crash rate, has 59 speed bumps and nine enhanced crossings.
Queens Boulevard offers the clearest corridor-level example. Once known as the “Boulevard of Death,” the corridor underwent an extensive redesign and has not seen a traffic fatality since 2014. Linden Boulevard, which has seen nine deaths since 2021, has taken on that grim distinction and prompted a new commitment from the Mamdani administration. Other corridors with heavy crash burdens—including Hillside and Jamaica Avenues in Queens and Eastern Parkway and Flatbush Avenue in Brooklyn—should be next in line for similarly sustained attention.
New York City’s street safety progress is real, and the city’s new transportation leadership appears to recognize the need for a more targeted next phase. At a March City Council hearing, DOT Commissioner Mike Flynn said the next Streets Plan should focus “squarely on outcomes, not just miles,” including whether fewer people are being killed or seriously injured and whether public space is high-quality and equitably distributed. That shift is encouraging. It aligns with what this analysis shows: the next phase of Vision Zero should be judged by whether the city is reducing harm in the neighborhoods facing the greatest danger.
But achieving those outcomes will require more than tracking key indicators. Some of the uneven geography of street safety investment reflects the realities of implementation: the city has often made the fastest progress in places where projects face the least resistance, where advocacy networks are strongest, or where local elected officials and community boards are more supportive. In other neighborhoods, needed safety improvements have been slowed, scaled back, or blocked amid concerns about parking, traffic flow, deliveries, or local process. Even DOT’s 2026 Streets Plan update acknowledges that some key street redesign projects were delayed, curtailed, or paused because of capacity constraints, political considerations, or legal challenges.
That dynamic will need to change. If the city is fully committed to reducing serious crashes where they remain highest, it will have to use data to push harder for interventions in the places that need them most—even when implementation is politically difficult. Local council members will need to advocate more forcefully for street safety improvements in their districts, rather than leaving DOT to absorb every conflict alone. And community engagement will need to become more strategic: working with credible local messengers—parents, older adults, school leaders, small business owners, clergy, tenant leaders, disability advocates, and neighborhood organizations—to make the case for the changes needed to keep residents safe and make streets more livable.
The city has the tools and a growing record of success. The challenge now is ensuring that livable streets interventions reach the neighborhoods that need them most.
New York City’s streets are where public life unfolds—for friends and families traversing their neighborhoods, commuters heading to and from work, students en route to school, and countless others. But for those daily journeys to be safe for all, the city must do everything within its power to ensure that attention and investment are being equitably distributed. Here are three steps that city officials can take to get there.
1. Refocus the next Streets Master Plan on driving better outcomes in the neighborhoods most at risk. Passed in 2019, the Streets Master Plan sets out annual goals for the installation of miles of bus and bike lanes, the total number of re-engineered intersections, and square footage of pedestrian space. The plan’s first iteration covered a five-year stretch, from 2022 to 2026, but the Adams administration failed to meet those targets each year in office. At a recent hearing, newly inaugurated NYCDOT Commissioner Mike Flynn said the agency would shift to “outcomes” as its metric instead.
To achieve better outcomes, the next phase of the Streets Master Plan, which will cover 2027 to 2031, should place heightened emphasis on street safety investments in high-need areas with above average crash rates and where conditions have worsened. City officials should use five-year rates of serious crashes and fatalities as their criteria to guide infrastructure installation, and focus on measures like hardened daylighting and major safety projects in neighborhoods where per-capita crash rates are higher than the citywide average. The NYCDOT commissioner is right to cite safety as an outcome to strive for; now local officials and communities should back that commitment with action in the neighborhoods that need it most.
2. Sunset voluntary ‘opt-in’ street safety initiatives. Measures like neighborhood slow zones are implemented by request only; community members must apply for them through NYCDOT. (Currently, the agency is not taking applications.) This approach creates inequities: not only do residents have to know about these interventions and then navigate city processes, but also, neighborhoods with organized advocacy networks are more likely to receive these interventions than those without them.
The city should consider a data-driven approach instead: if a community has an above-average crash rate, it should automatically qualify as a neighborhood slow zone and receive corresponding interventions. But successful implementation will still require strong public education and robust community engagement. Rather than relying primarily on community boards—which often do not fully reflect the broader neighborhood—city officials should pair these changes with wider outreach to residents, parents, seniors, small businesses, and other stakeholders. That is a worthwhile lesson ahead of the Mamdani administration’s rollout of lowered speed limits across school zones.
3. Launch a Street Safety Rapid Response Team focused on high-risk neighborhoods. One of Vision Zero’s greatest strengths has been using data to target interventions block by block. The city should build on that model by creating a dedicated interagency team charged with identifying neighborhoods where serious crashes remain elevated or have worsened, then accelerating tailored responses—from redesigning dangerous corridors and intersections to enforcement, outreach, and public health interventions. Housed in City Hall through the Mayor’s Office of Vision Zero, the team should publish goals, track progress, and be accountable for results.
Appendix: Where crash risks remain highest and where conditions are worsening
Since 2014, New York City has made substantial progress overall: the citywide rate of crashes causing death or injury has declined, and total crashes have fallen even more sharply. But serious crashes have not dropped nearly as fast as total crashes—down just 2 percent, compared with a 60.9 percent drop in all crashes citywide.
In 2020, emptied streets during the COVID-19 pandemic contributed to a surge in reckless driving and a historic spike in severe crashes. The need for a more targeted next phase is clear: since 2021, the rate of crashes causing injury or death has increased in 35 of the city’s 55 community districts, with those increases concentrated overwhelmingly outside Manhattan.
The highest serious crash rates remain concentrated in many lower-income communities of color and immigrant-dense neighborhoods. Canarsie and Flatlands now have the city’s highest rate of crashes causing injury or death, at 84.3 per 10,000 residents—nearly double the citywide average of 47 per 10,000 residents. Melrose, Mott Haven, Longwood, and Hunts Point rank second highest at 69.9, followed by Queens Village, Bellerose, and Rosedale at 68.0, East Flatbush at 67.0, and East New York and Cypress Hills at 66.6. In total, eight of the ten neighborhoods with the highest per-capita serious crash rates are lower-income communities of color.
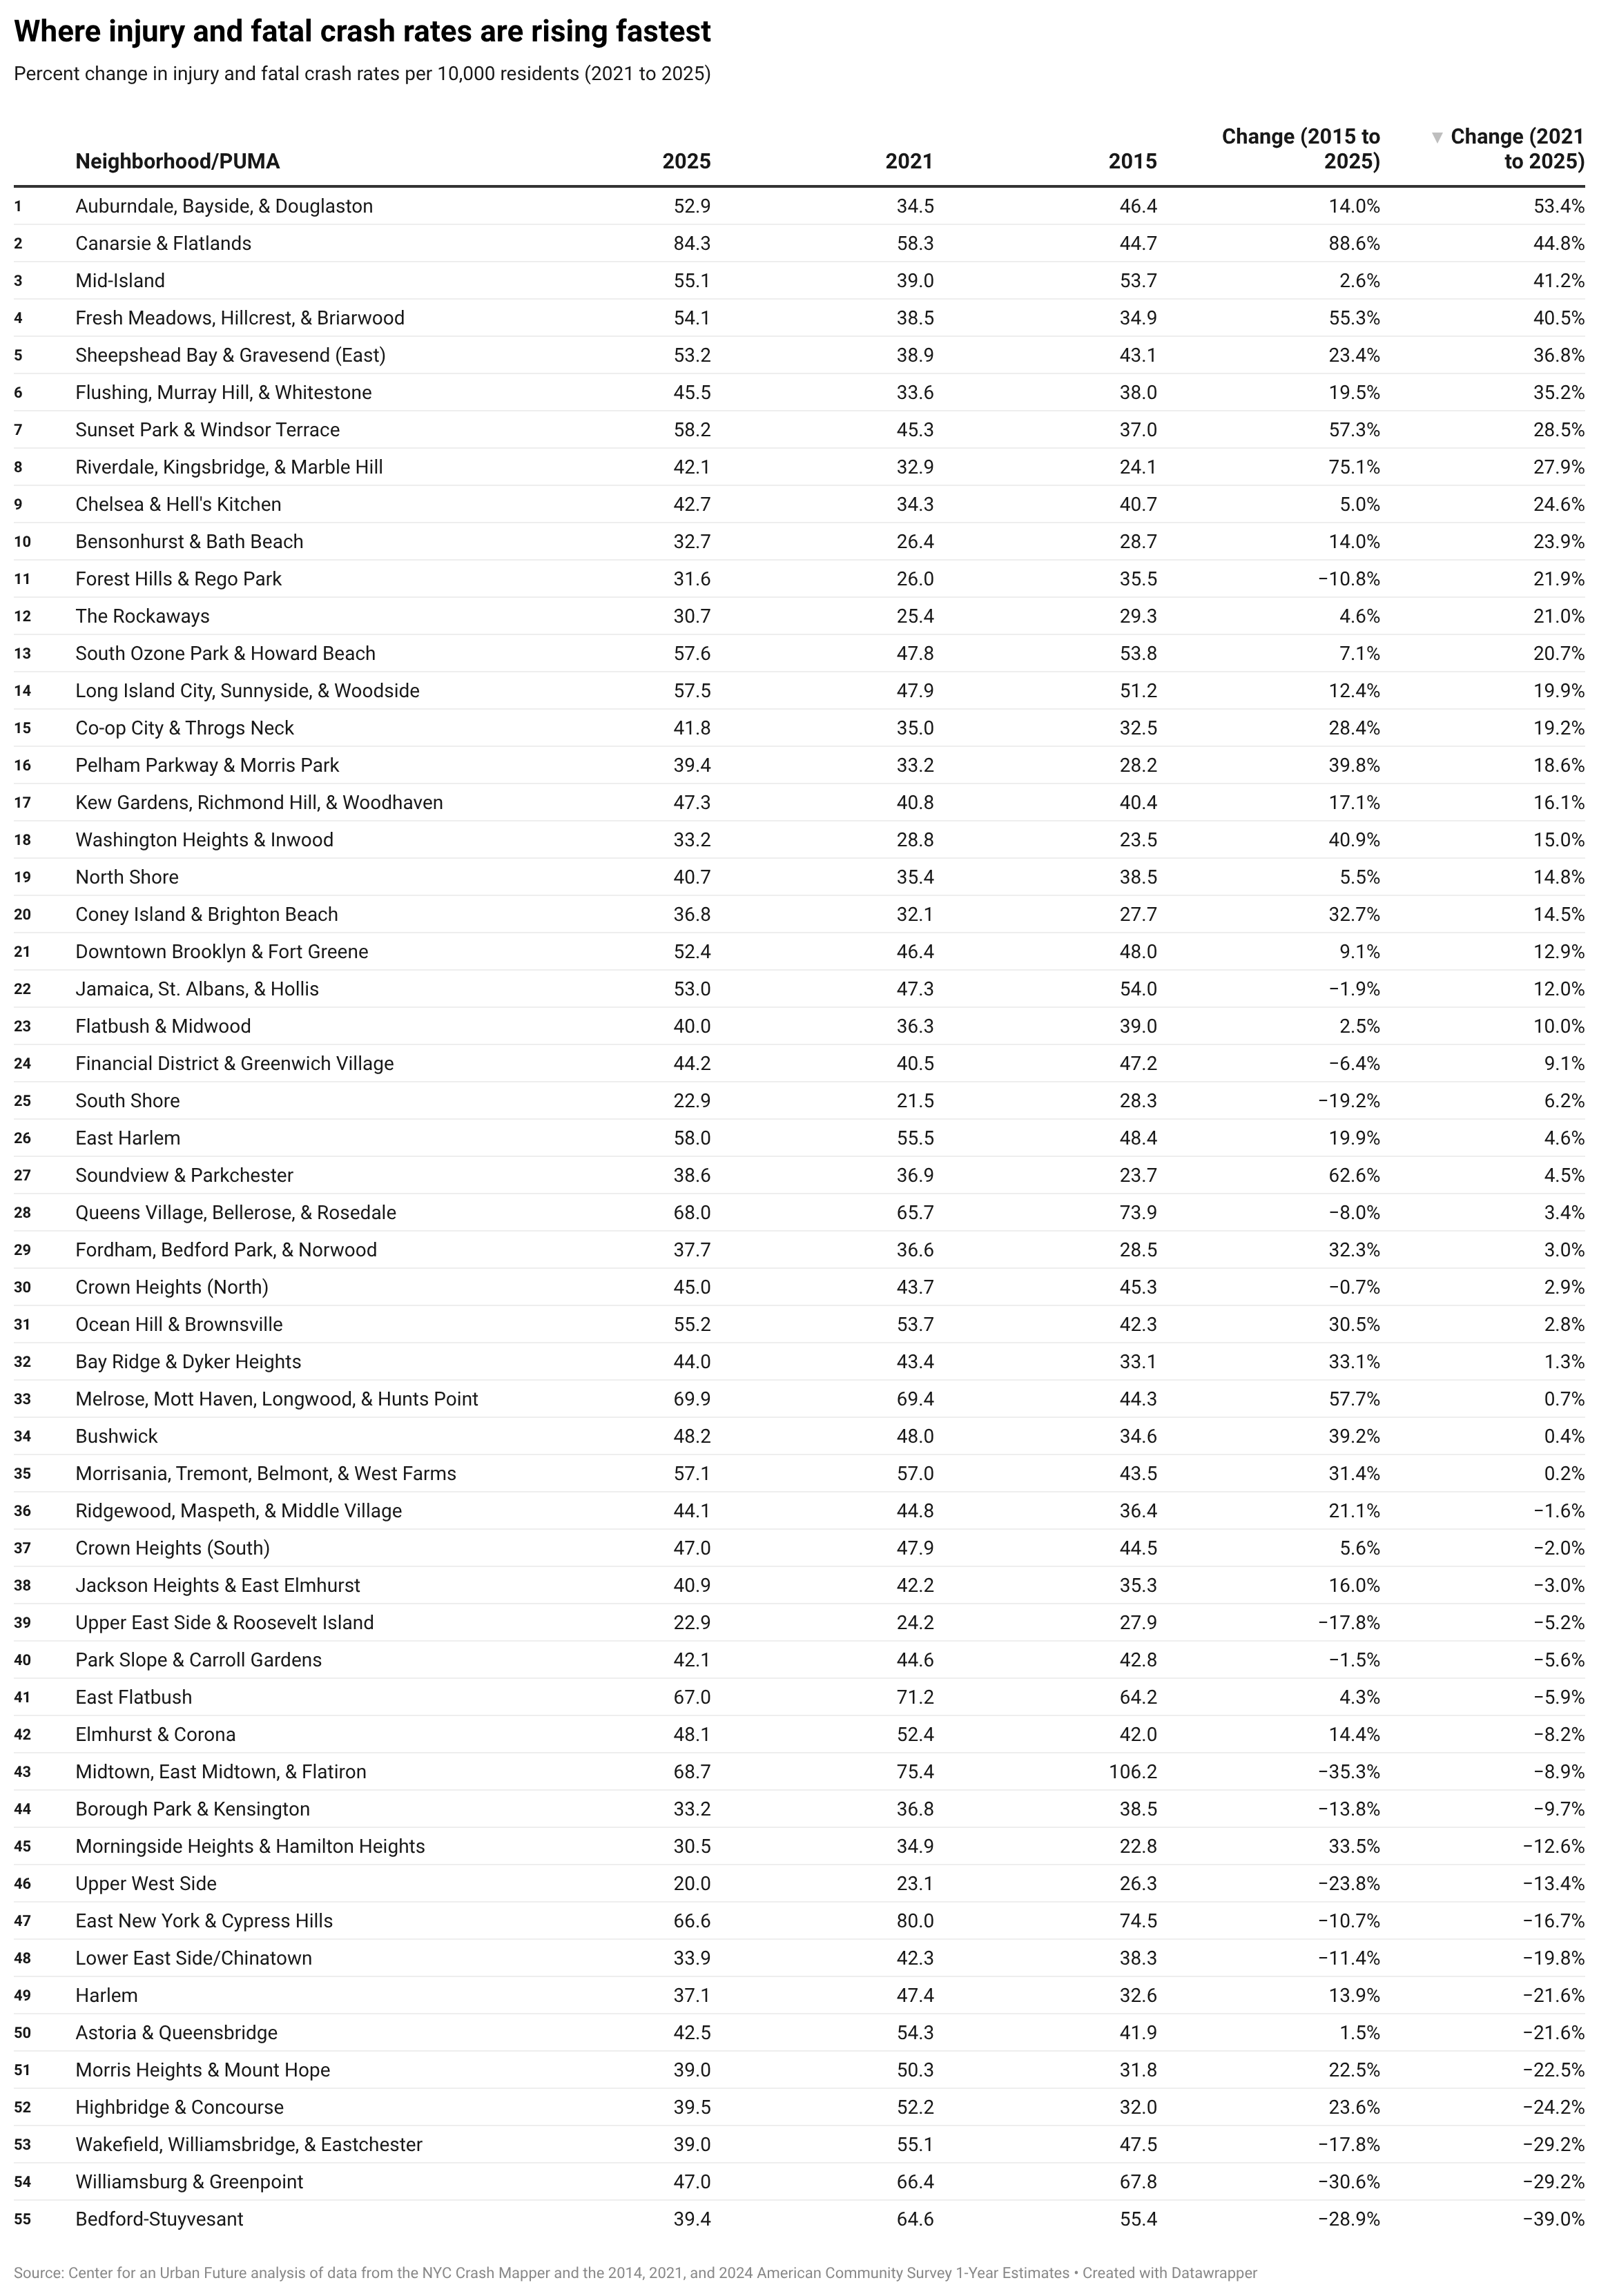
Several neighborhoods with already elevated crash rates are also moving in the wrong direction. Since 2021, serious crashes increased in many neighborhoods including: Auburndale, Bayside, and Douglaston (by 53.4 percent), Canarsie and Flatlands (by 44.8 percent), Fresh Meadows, Hillcrest, and Briarwood (by 40.5 percent), Sheepshead Bay and Gravesend (East) (by 36.8 percent), and Sunset Park and Windsor Terrace (by 28.5 percent). These patterns underscore that while many of the city’s highest risks remain concentrated in lower-income communities, growing concerns are also emerging in middle-income, car-dependent, and fast-changing neighborhoods across the boroughs outside Manhattan.
Endnote
1. Center for an Urban Future analysis of data from NYC Crash Mapper. Underlying vehicle collision data is sourced from the NYC Open Data portal. Throughout this report, we use “serious crashes” to refer to crashes that result in fatalities or injuries, including to pedestrians, cyclists, and motorists.

_300_380_bor1_a4a4a4.jpg)